Honest safety
Recorded crime weighted by how seriously the courts treat it — one robbery counts far more than a stolen chocolate bar. Updated monthly from data.police.uk.
Every neighbourhood in England
Balworth paints all 32,844 of England’s neighbourhoods — crime severity, house prices, deprivation, air quality and community. Green ranks better, rose ranks worse. Every figure describes an area of about 1,500 people, never a single address.
No account needed to look around.
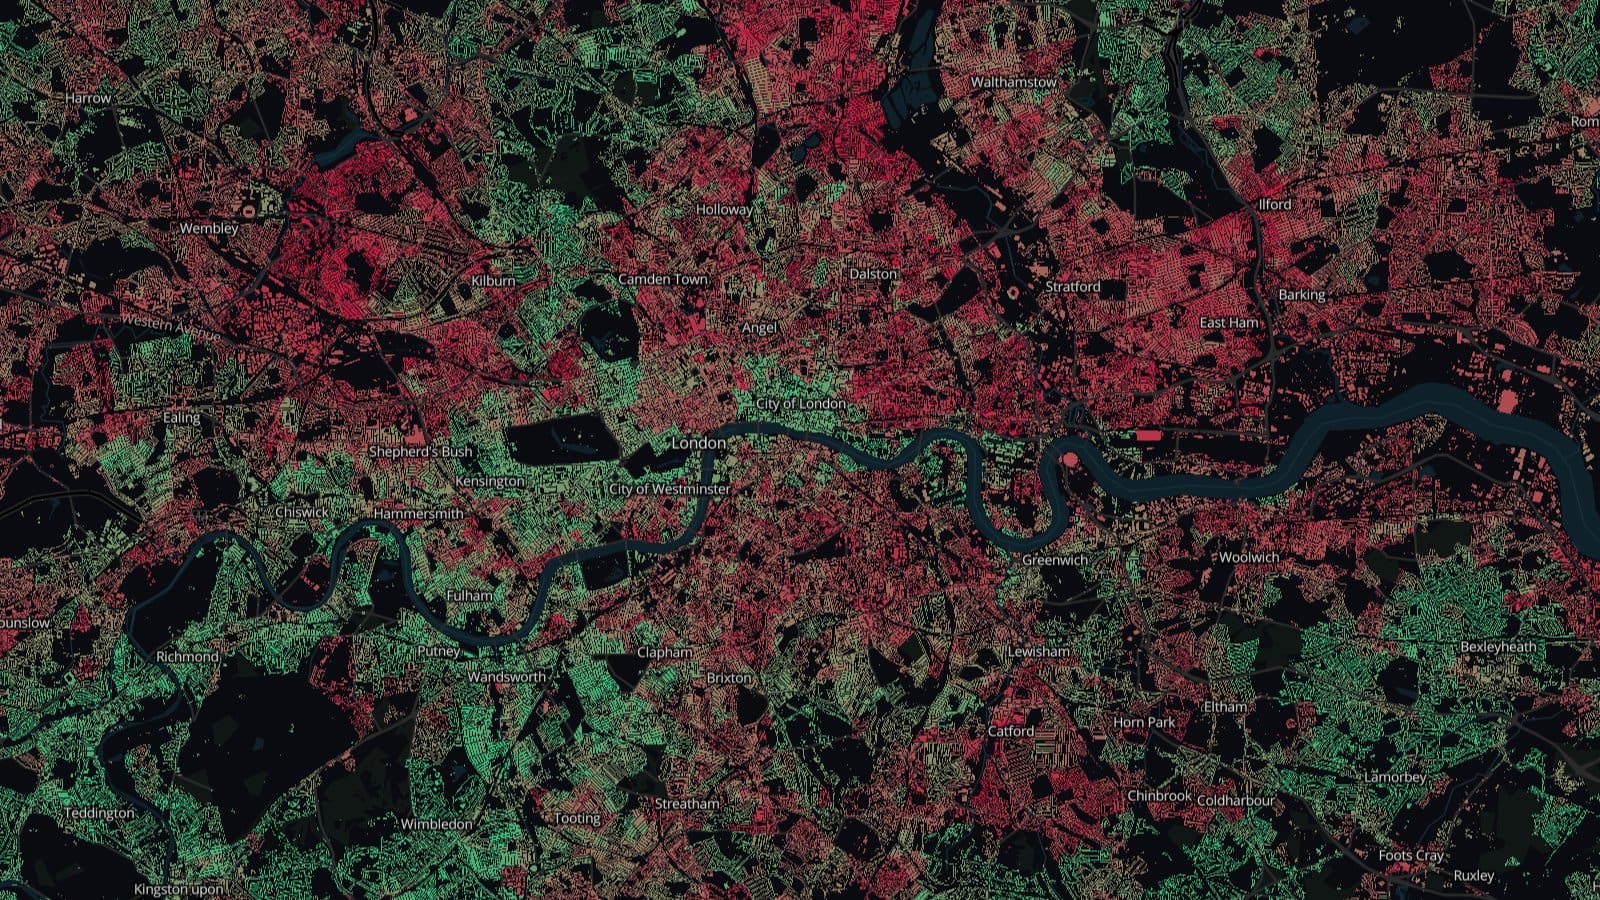
Recorded crime weighted by how seriously the courts treat it — one robbery counts far more than a stolen chocolate bar. Updated monthly from data.police.uk.
The median price actually paid on each street's neighbourhood, not the borough average — plus affordability against local incomes.
The brand-new Indices of Deprivation across all seven domains — income, work, education, health, crime, housing and environment.
Census 2021 at full resolution: age, faith, birthplace, education and tenure — who the census recorded living there.
Fine-particle pollution and road traffic as living heat clouds — spot the quiet clean pockets two streets from the A-road.
Stations, schools, GPs, gyms, nature reserves, football grounds — 76,000+ points with rough distance rings.
The map is free for everyone. Subscribe to see every layer of England.
Sign in on the map, then subscribe — two clicks.
Official open sources only: police-recorded crime from data.police.uk (12 months, refreshed monthly), MHCLG Indices of Deprivation 2025, ONS Census 2021 and price paid data, Defra air quality and DfT traffic counts. Colours rank each neighbourhood against the whole of England.
No map is. Balworth shows honest, recent, official statistics — but a neighbourhood is also the neighbours, the light, the bakery. Use it to shortlist; visit before you decide.
Each nation has its own statistics bodies, deprivation index and police data. We build each region properly rather than stretching one dataset thin — so you only pay for the region you're actually searching.
Yes — the subscription is monthly with no lock-in. Cancel in two clicks from the account menu on the map, and you keep access until the end of the period you've paid for.